GPS coordinates are everywhere these days – whether you use Google Maps, a Garmin device, or a navigation app on your smartphone to find directions.
GPS coordinates are critical for displaying your own data using GIS. Want to know how to do it yourself? Read on.
What does GPS stand for?
GPS: Global Position System. It is the system for giving the exact coordinates of where you are on the Earth, or where your data is from. There are a few different ways of showing GPS coordinates. Here’s what you need to know:
There are two main formats for giving GPS coordinates:
- Longitude-Latitude
- Shows “Degrees”, then “minutes”, then “seconds”, then “direction”
- 41°25’01″N and 120°58’57″W
- You can read this as “41 degrees, 25 minutes, 1 second, North”, “120 degrees, 58 minutes, 57 seconds, West”
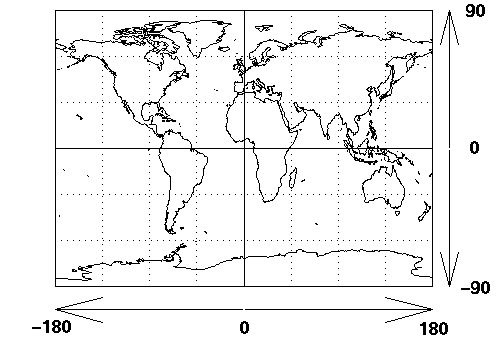
- Latitude is measured based on the distance away from the equator, from 0 to 90, either North or South, as shown below.
- Longitude is measured based on the distance away from the Prime Meridian, from 0 to 180, either East or West, as shown below.
- Sometimes, instead of N, S, W, or E, you are given just a positive or negative GPS coordinate. For example, 45 degrees South is the same as -45 degrees.
- Sometimes, in a latitude/longitude format, your “seconds” will have a decimal. For example, it might look like:
- 41°25’01.78“N and 120°58’57.45“W
- Decimal Degree
- Decimal degree is exactly the same as longitude-latitude coordinates shown above, except it turns the format into a simple decimal number.
- To convert 41°25’01″N into a decimal degree, this is what you’d do:
- 41° turns into the number “41”
- 25 minutes turns into a fraction of an hour. There are 60 minutes in an hour, therefore 25 divided by 60 equals 0.4167. We add this fraction to our original number, “41” and get “41.4167”.
- 01 seconds also turns into a fraction of an hour. There are 3600 seconds in an hour, therefore 01 divided by 3600 equals 0.000278. We add this fraction to our existing number and get “41.416978”
- Because the direction is “N”, and “N” is positive (see picture above), then our number stays positive. If our direction was “S”, our decimal degree number would become “-41.416978”.
- Remember,GPScoordinates must have both a latitude (North/South) and a longitude (East/West).
- 41°25’01″N and 120°58’57″W would become:
- 41.416978, 120.9825
- 41°25’01″N and 120°58’57″W would become:
Just so you know – there are other formats that GPS data can come in. For now, understanding the above difference is enough.
What format is best for GIS?
In your GIS programme, you’ll want to have your GPS coordinates in “Decimal Degree”. So, if you were setting up a table of data that you wanted to display in GIS, here’s what a table could look like:
| Name of your data | Longitude (X) | Latitude (Y) |
| Point 1 | 27.7909947 | 6.755476263 |
| Point 2 | 26.32972708 | 9.506225325 |
| Point 3 | 27.28788105 | 6.59420837 |
| Point 4 | 32.4219918 | 8.483908078 |
| Point 5 | 31.41116024 | 8.656945542 |
Save your data in Excel, but save it in the format “.csv”, which stands for Comma Separated Values. You do that by clicking on the following:

Once you’ve saved your data in a table such as this, open up your desktop GIS programme. I use QGIS, and if you’re just starting out, I suggest you use QGIS as well – it’s free. But this method should work no matter what GIS programme you use.
In QGIS, go to Layer > Add Delimited Text Layer…

Hit the “Browse” button on the window that pops up:
Find the .csv file you just saved and click on it, and click Open.
Now your data will show up in the window in QGIS. First, in the drop-down menu beside “X Field”, choose your column that shows “Longitude (X)”. In the drop-down menu beside “Y Field”, choose your column that shows “Latitude (Y)”.
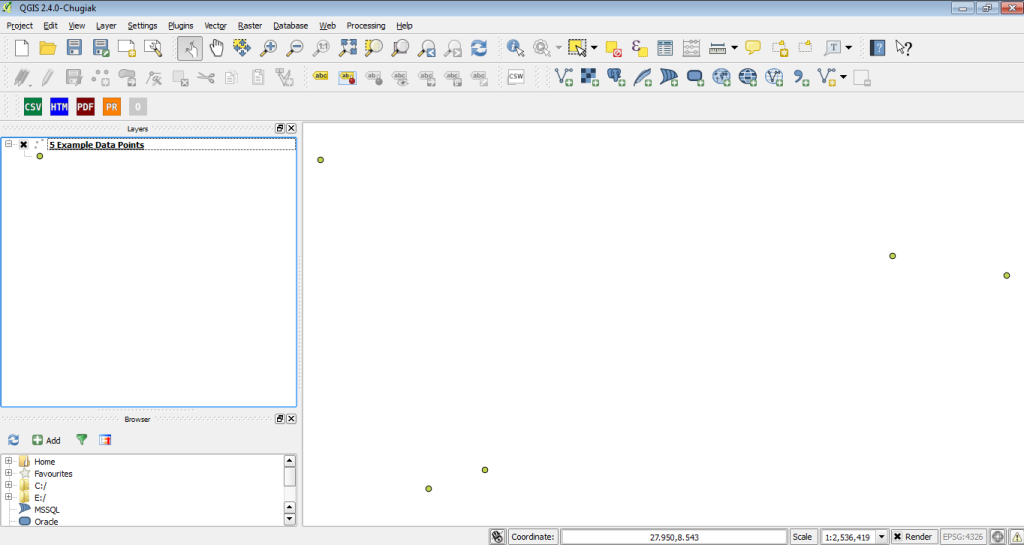
If asked to define a projection, just use the “WGS 84” projection. And lo and behold, your data should pop up in your map canvas!
Did it work? Please share any difficulties or successes you had in the comment box below!


